
WHERE WERE WE BEFORE THE WAR?
EMPLOYMENT
To understand the current macro backdrop, it is essential to begin with the labor market — specifically, how the definition of “balance” has shifted..
Recent work, including estimates from the Dallas Fed, suggests that the level of job creation required to keep the unemployment rate stable — the so-called “break-even” employment — has declined materially.
I believe we’re in a recalibration.
For years, the “break-even” number was propped up by a massive surge in unauthorized immigration. In 2023, we needed 250,000 jobs a month just to keep the unemployment rate from rising. But that engine has been changed.
According to the latest microdata—immigration court records and self-deportation figures—net unauthorized immigration didn’t just slow down; it turned into a massive outflow. We are talking about a net loss of 55,000 people per month in the second half of 2025. For the full year, we’re looking at a net outflow of 548,000 people. That is 50% larger than what the CBO was projecting.
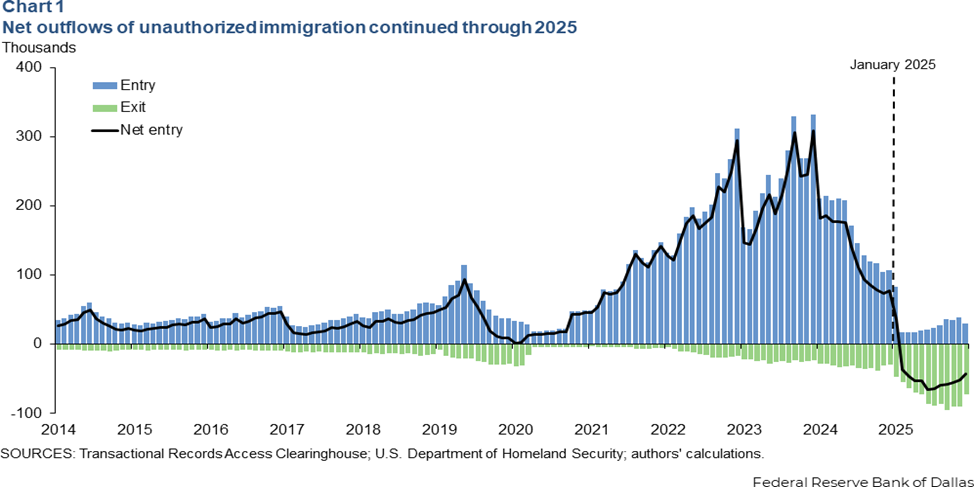
When the population shrinks, the number of jobs you need to stay “balanced” drops. The Dallas Fed’s model shows that the break-even rate fell from that 250,000 peak in 2023 to basically zero by the end of 2025. In fact, from August to December, the break-even was actually -3,000 jobs per month.
You read that right: in this environment, we could technically lose a few thousand jobs and the unemployment rate wouldn’t even budge.
It isn’t just about the border. We are also dealing with a “demographic drag” as labor force participation continues to slide.
The Dallas Fed ran a counterfactual: if participation had stayed constant, we’d still need about 30,000 jobs a month. But people are dropping out, and when you combine that with the immigration outflows, it amplifies the downward pressure on the labor supply.
Instead of a “flood” of new workers, we have a “trickle,” and in some months, a “leak.”
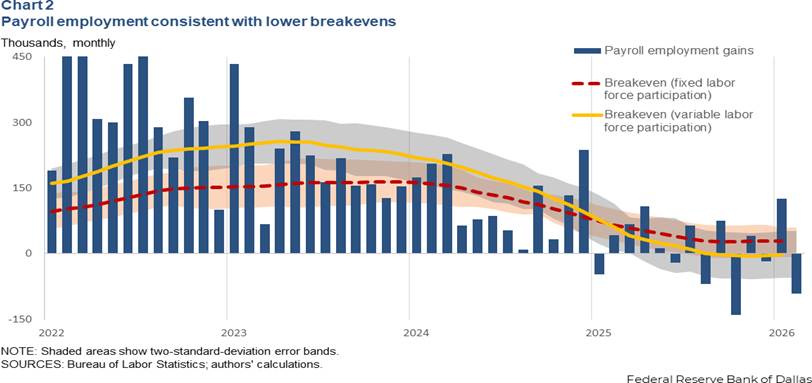
This is the part many bears get it wrong. They see a payroll report showing 50,000 or 60,000 jobs and they start worrying about a recession.
But look at the three-month average from December to February. Job growth actually exceeded the new, lower break-even rate. This is why the unemployment rate is staying stable despite the “softer” headline numbers.
The U.S. labor market isn’t dying; it’s just operating with a smaller denominator.
The “slump” everyone is worried about is largely an illusion caused by using outdated benchmarks. In late 2025, payroll gains that historically would have signaled a weak economy are now perfectly consistent with a balanced, healthy labor market.
We’ve moved from a growth model fueled by a population surge to a model where “flat” is the new “up.” If you understand this, the employment reports stop looking like a crisis and start looking like a successful landing.
If you go back to the employment report, the prime-age labor force participation (25-54) is secularly strong. This is the core engine of the economy, and it’s firing on all cylinders. Any drop you see in the overall civilian line is largely a demographic story—not a cyclical one. However, we have to recognize that this demographic shift creates a lower ceiling for how fast the economy can actually grow.
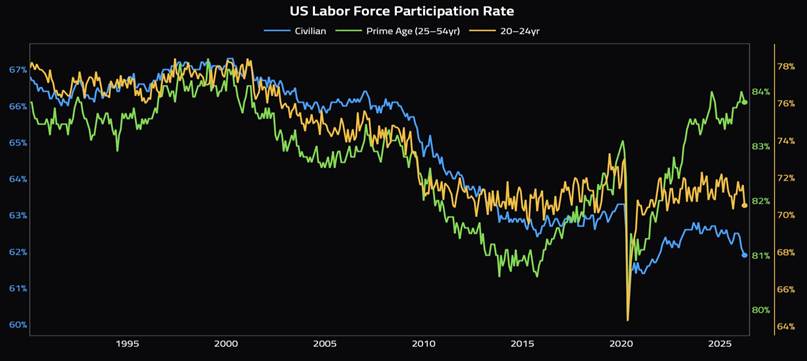
One area that had a lot of people worried was youth unemployment. The data there is actually quite encouraging. Since December, the youth unemployment rate has been plunging. It’s a clean move that should alleviate some of the concerns about the youngest cohort of the workforce.
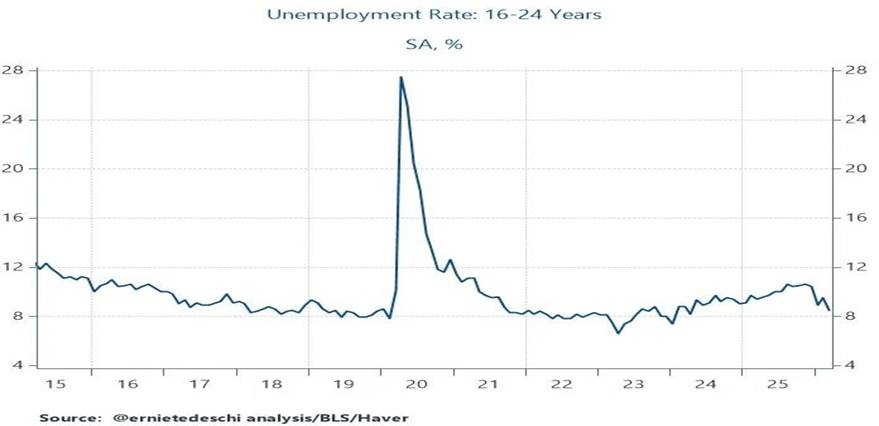
Maybe the ones who can truly run all of those AI agents are the youth.
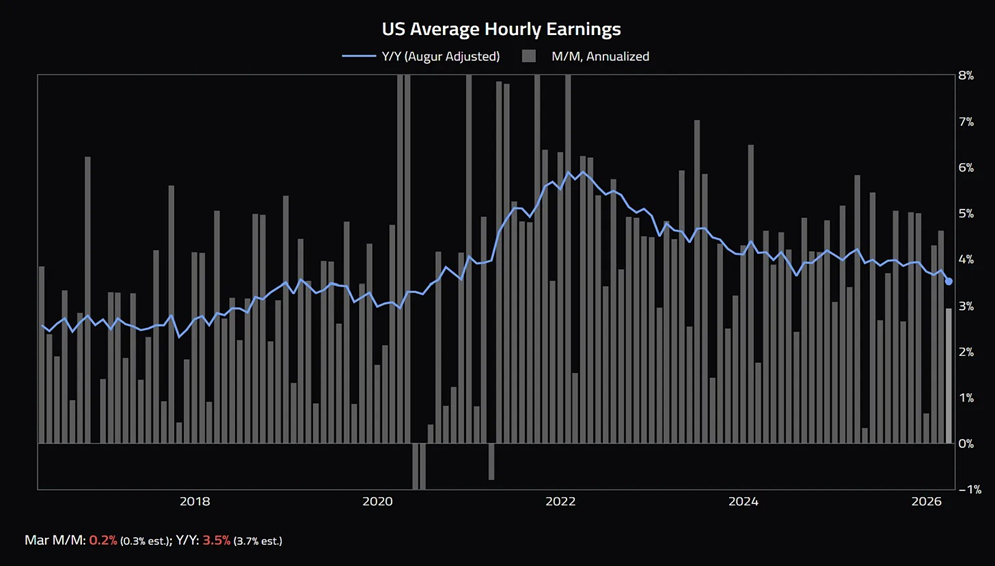
Another aspect is wage growth has been slowing gradually, but it remains significantly higher than the pre-COVID baseline. This is because inflation becomes sticky over time—both in terms of what people expect to get paid and what companies expect to charge.
Before the war, I would have bet that strengthening demand would eventually flow through to higher wages with a lag (our 2026 outlook). It would be a mistake to look at the current numbers and project weakness. In my mind, this wage stickiness is far more critical to the inflation outlook than academic metrics like the 5-year/5-year forward inflation rate.
That forward rate is a market rate distorted by flows and, frankly, it’s mostly irrelevant to the real world. Trading based on that stuff is as speculative as guessing the exact date of the technological singularity. Stick to the actual wage data.
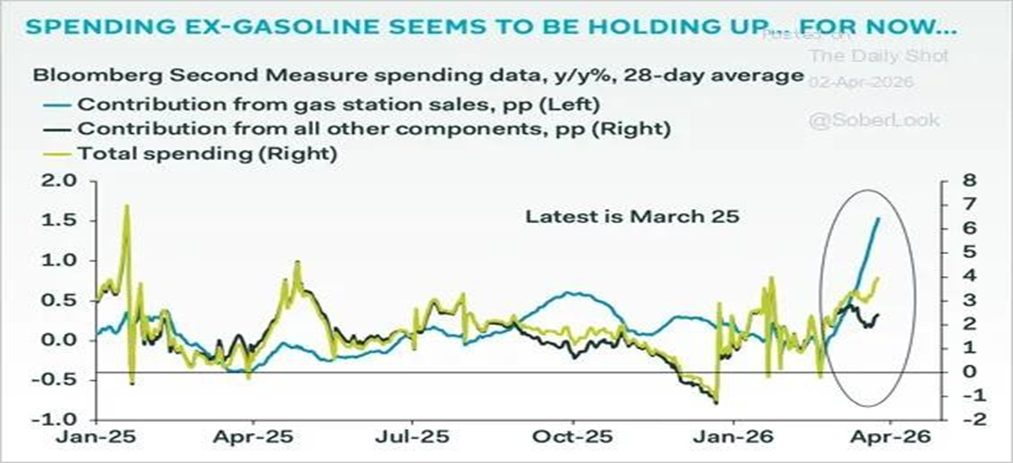
The last point in this employment section is demand. Prior to the war, demand was perfectly fine. These measures are current, and they tell a different story than the official retail stats, which have looked a bit shaky. In recent months, these numbers have shown more resilience and strength than the headlines suggest. The appetite for consumption was there.
BROKEN DISINFLATION | THE LOWER TAIL IS BROKEN — AND INFLATION IS NO LONGER SELF-CORRECTING
In terms of inflation, the Fed researchers just dropped a note on this issue. The researchers ask if the inflation process has fundamentally changed. The short answer? Yes.
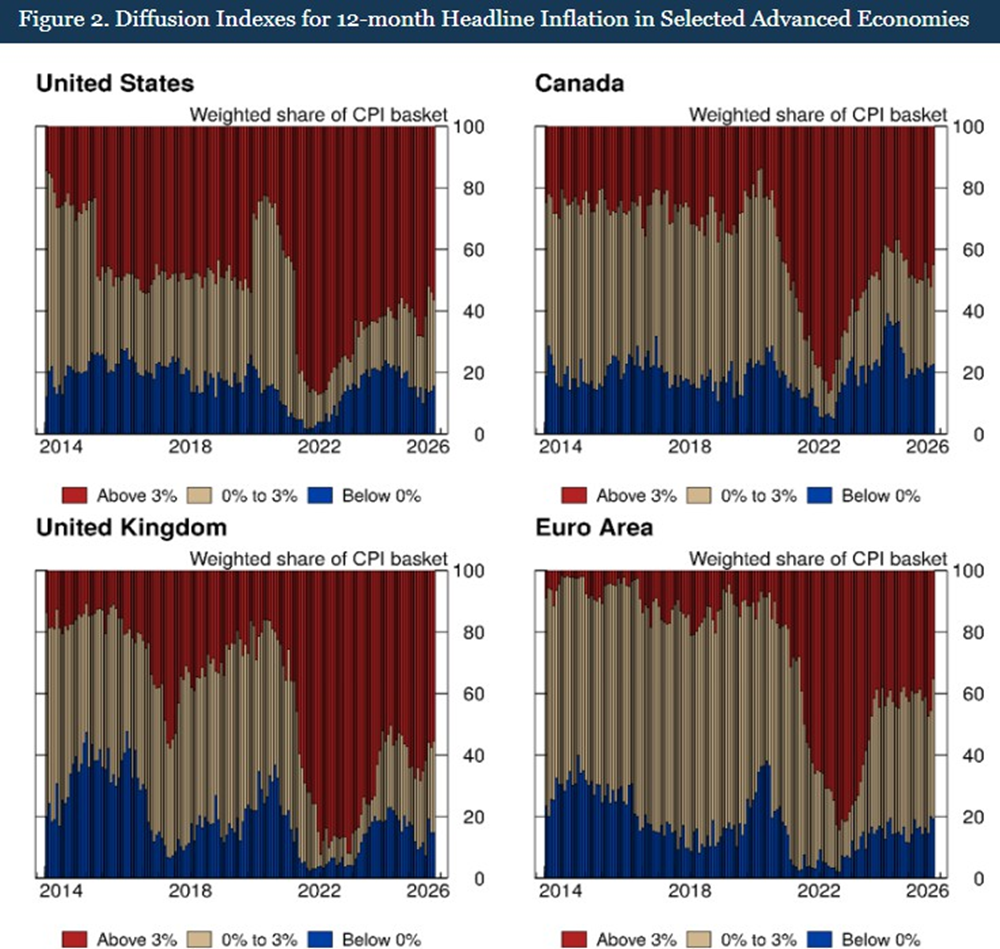
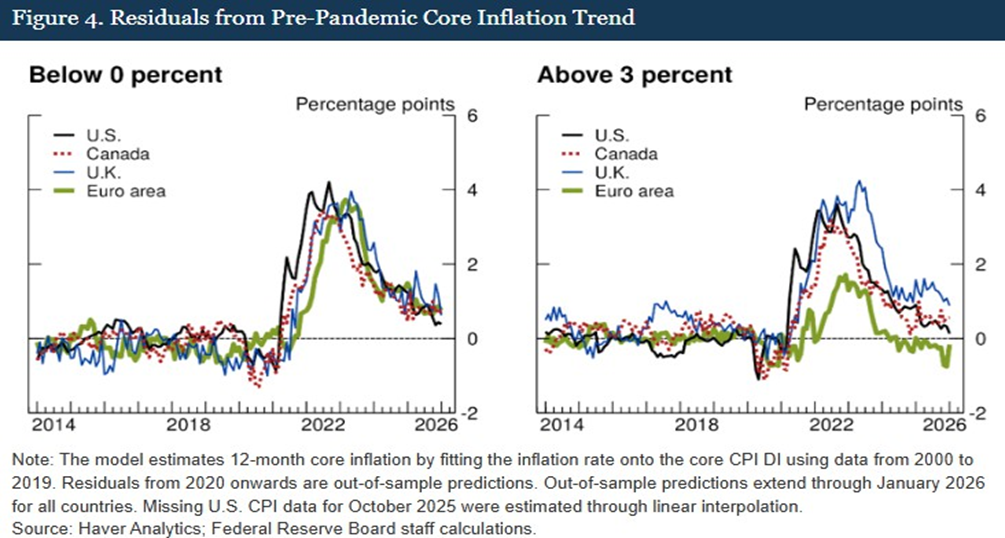
To understand this shift, it is useful to contrast the current environment with the disinflationary regime that characterized the 2010s. The researchers looked at “diffusion indexes”—which basically measure how many categories of stuff are getting more expensive at the same time. Even with headline numbers coming down, the breadth of inflation is still historically high.
At the height of the inflation surge in 2022, roughly 80% of the CPI basket was rising at an annualized pace above 3%.
We’ve cooled off since then, but the share of the basket stuck above 3% is still double what it was from 2014-2019.
Historically, there was a reliable link between the “tails” of price changes and the headline number. If a few sectors saw prices drop (deflation), it pulled the whole average down.
The Fed’s models show that this relationship has snapped. Specifically, the “lower tail” is broken. Even when some goods see price declines, those declines aren’t pulling down aggregate core inflation the way they used to. The “disinflationary pull” of the 2010s is gone.
If this historical relationship were still intact, current inflation readings would likely be materially lower. The persistence of inflation despite these dynamics points to a structural change in how price pressures propagate through the economy.
If you want to know who to blame, look at the service sector. While goods inflation is moderate (except in North America, where tariffs are a headache), non-housing services are a runaway train.
Why? Wages.
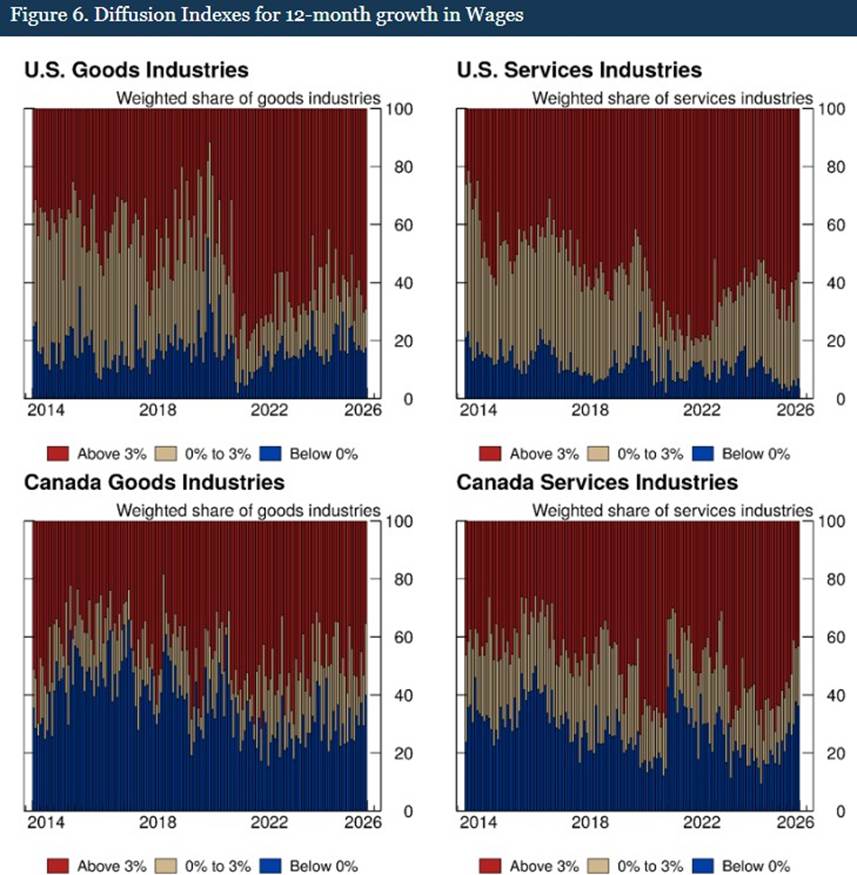
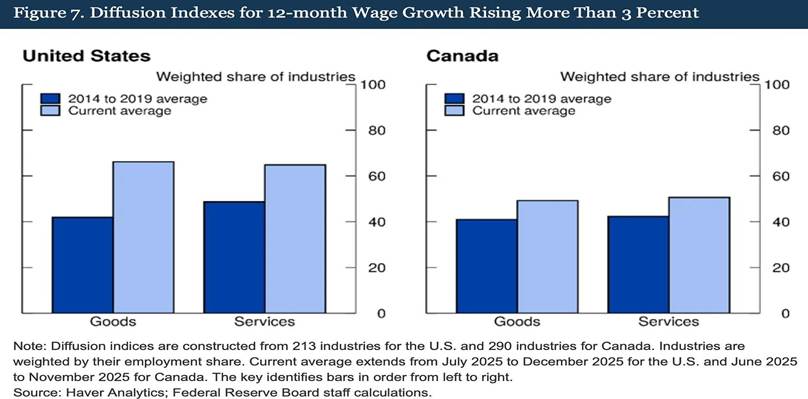
The Fed constructed diffusion indexes for wages, and the results are not so good for the “disinflationary” crowd. In both the US and Canada, a massive share of industries is seeing wage growth above 3%. This is especially true in services, where labor is the biggest cost.
As long as wages are rising broadly at these levels, service prices will stay sticky. You can’t have 4% wage growth across the board and expect 2% inflation. The math doesn’t work.
So the bottom line is that the Fed’s researchers are basically showing that the “inflation process” has evolved. We aren’t just dealing with a “temporary normalization” or a lingering supply chain issue.
- Weaker disinflationary forces: The mechanisms that previously anchored inflation lower have diminished.
- Persistent breadth: Price hikes are now widespread and coordinated across sectors.
- Services-driven floor: Wage growth in services has created a floor that makes the 2% target look like a pipe dream without a massive economic hit.
The current inflation backdrop aligns with our 2026 global outlook.
In effect, the Fed may be targeting a 2% outcome in an environment where the underlying inflation equilibrium is structurally higher. This dynamic reinforces a ‘higher-for-longer’ rate regime and helps explain the recent divergence in rates markets, where longer-term yields have repriced higher while the front end remains anchored by near-term policy expectations.
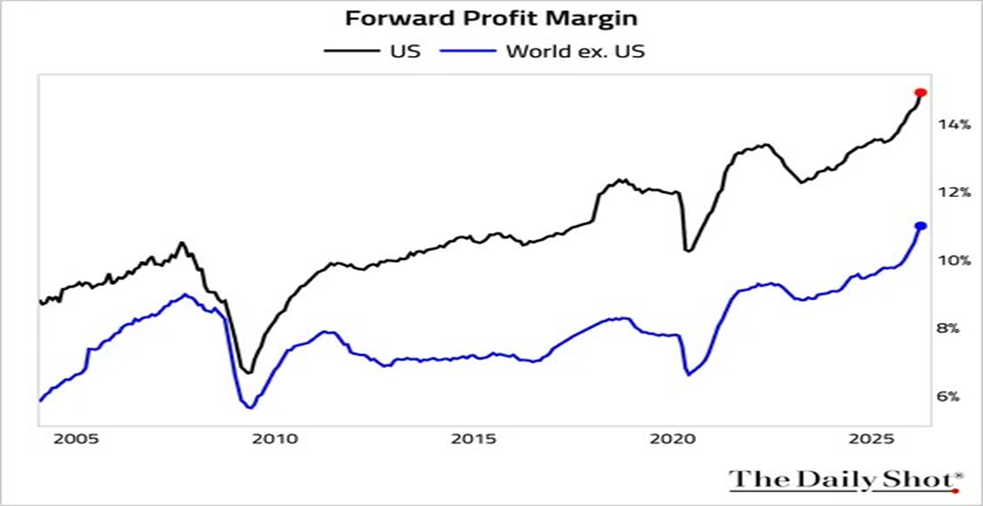
NOTHING MATTERS — UNTIL IT DOES | EARNINGS STRENGTH, MARGIN PEAKS, AND THE ILLUSION OF STABILITY
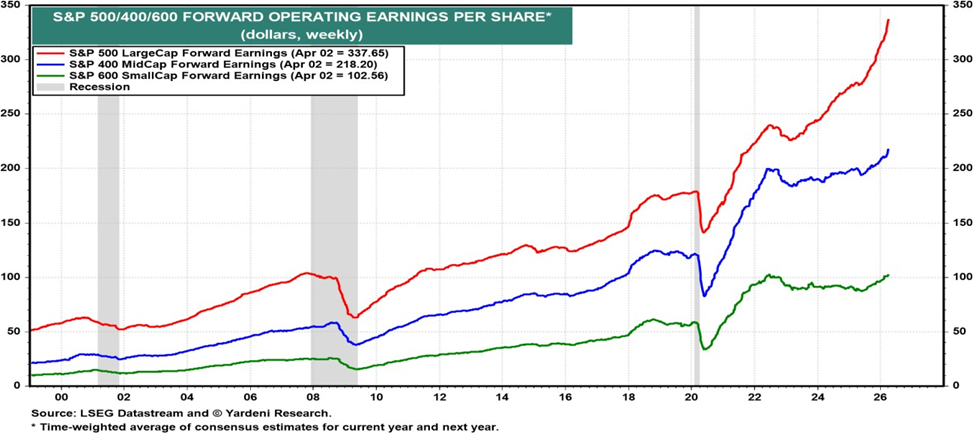
Forward earnings expectations for the S&P 500 continue to trend higher, with a notable broadening across market segments. Both mid-cap (S&P 400) and small-cap (S&P 600) earnings are increasingly participating in the upward revision cycle, suggesting a more generalized improvement in corporate performance.
From a market perspective, this expansion in earnings breadth is typically viewed as a constructive signal, indicating that growth is not solely concentrated in a narrow set of large-cap names.
However, this strength must be viewed in context.
Profit margins remain elevated by historical standards, while valuations continue to trade near the upper end of their recent range. Implicitly, markets are pricing a continuation of the current equilibrium — one in which earnings remain resilient, margins hold near peak levels, and financial conditions tighten only gradually.
This dynamic reflects a broader tendency to extrapolate stability, where risks are discounted until they become sufficiently visible to challenge the prevailing narrative.
The key tension lies in the interaction between strong earnings momentum and a shifting macro backdrop. As discussed previously, the cost of capital is being structurally repriced, while wage pressures and input costs remain elevated.
As a result, while current earnings trends provide near-term support for equities, they may also represent a late-cycle dynamic — where strong reported performance coexists with increasing underlying fragility.
GROWTH | WHY ABOVE-TREND MOMENTUM MAY NOT ABSORB THE SHOCK
Prior to the recent geopolitical escalation, global growth was running modestly above potential, providing a degree of cyclical buffer against external shocks. Estimates suggest that global activity was tracking close to 1 percentage point above trend.
However, this cushion is unlikely to prove durable.
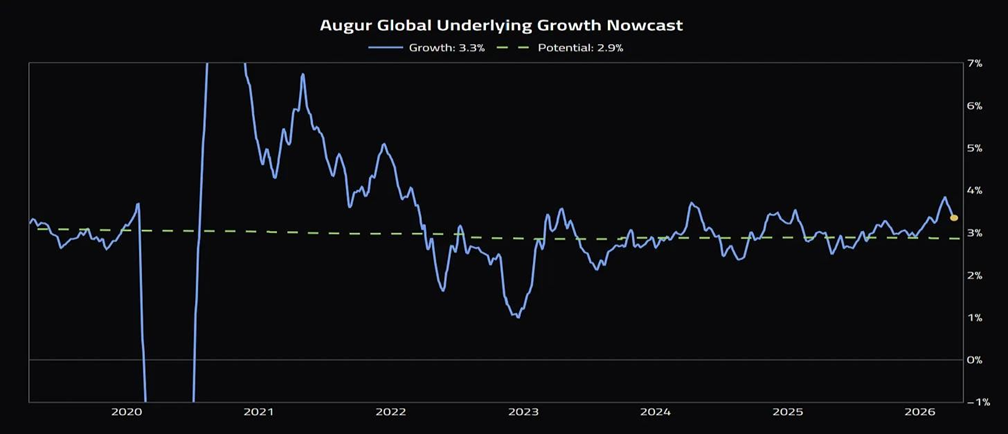
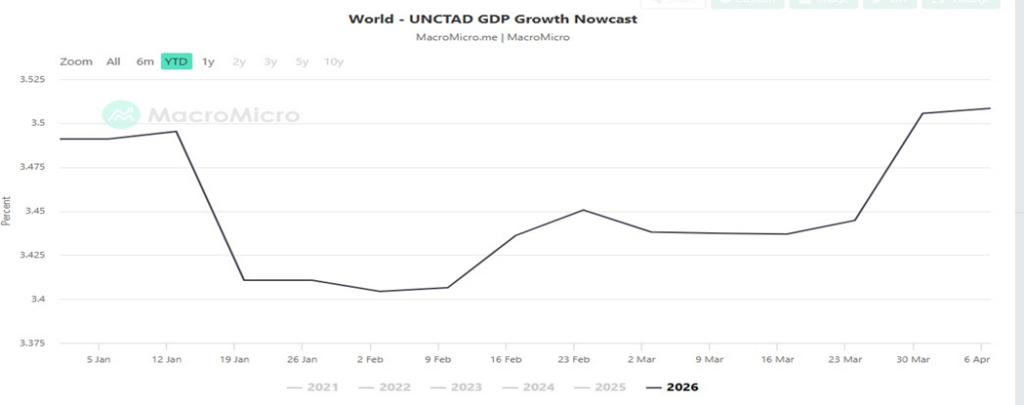
High-frequency indicators reinforced this view. The UNCTAD GDP nowcast showed a gradual reacceleration in global activity from late January through March, indicating that momentum was improving rather than deteriorating immediately prior to the escalation.
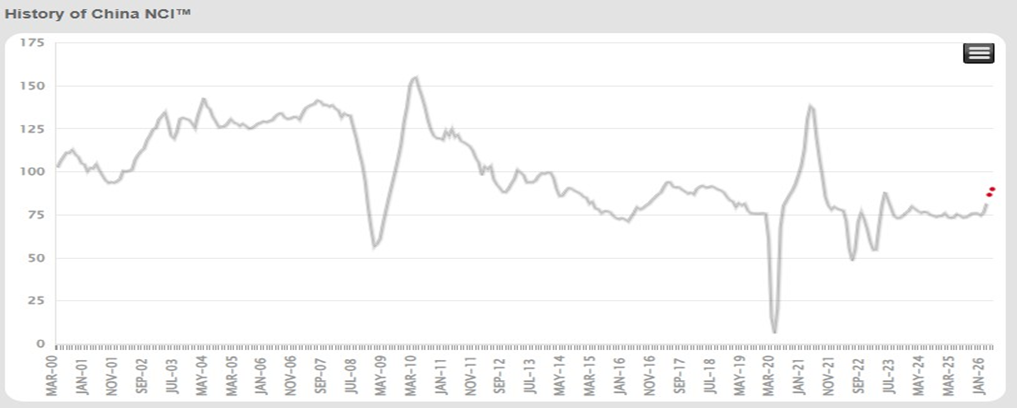
However, the composition of this growth was less uniform across regions.
In China, activity appeared to be stabilizing following a prolonged period of weakness. While recent data points to a bottoming process, the recovery remains measured, suggesting that China is transitioning from a drag on global growth to a more neutral contributor — rather than re-emerging as a primary engine.
In Europe, growth dynamics were similarly mixed. Early-quarter strength in activity indicators gave way to more subdued readings, with revisions reflecting a divergence between softer survey data and more resilient hard data. This points to a fragile stabilization rather than a sustained acceleration.
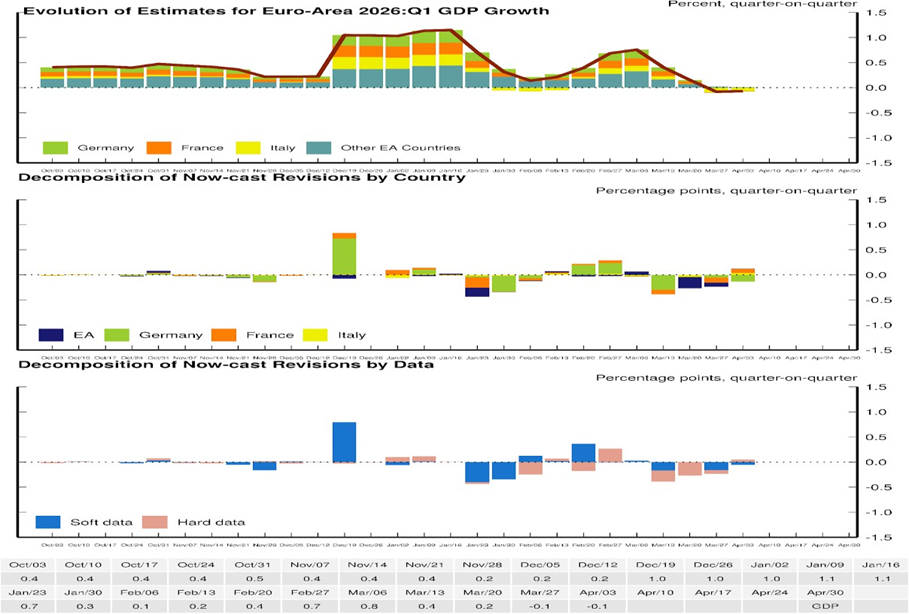
As these forces take hold, global growth is likely to converge back toward, or potentially below, trend. In this context, the central risk is not an abrupt collapse, but a gradual erosion of growth in an environment where inflation remains elevated and policy flexibility is limited.
FROM RESILIENCE TO REPRICING
Prior to the escalation, macro conditions were far from distressed. Growth was running above trend, labor markets remained stable, and inflation — while elevated — was evolving in line with our 2026 outlook of gradual reflation.
A key source of misinterpretation in 2025 was the perceived “cooling” of the U.S. labor market.
Recent estimates from the Federal Reserve Bank of Dallas indicate that the break-even rate of employment growth—the level of job creation required to maintain a stable unemployment rate—declined materially over the course of the year, reaching levels close to zero by late 2025.
This shift reflects a structural contraction in labor supply, driven by reduced immigration flows and declining participation. As a result, payroll prints that would historically have signaled weakness became consistent with a stable labor market.
Inflation dynamics had also evolved prior to the onset of the shock. What began as a post-pandemic price adjustment had transitioned into a more persistent and broad-based process. Measures of inflation breadth remained elevated, with approximately 80% of the CPI basket rising above 3% at the peak—still materially above pre-2019 norms even after partial moderation.
At the same time, wage growth—particularly in labor-intensive service sectors—remained elevated, reinforcing a structural floor under inflation. In this context, a sustained return to a 2% inflation target would likely require a materially tighter macroeconomic adjustment.
Equity markets reflected a similarly constructive, but increasingly stretched, backdrop.
Forward earnings expectations for the S&P 500 continued to trend higher, with a notable broadening across mid- and small-cap segments. This expansion in earnings breadth is typically interpreted as a positive signal, indicating that growth is not narrowly concentrated.
However, this strength was accompanied by persistently elevated profit margins and valuations near the upper end of their recent range. This suggests that markets were implicitly pricing a continuation of stable growth, resilient earnings, and only gradual tightening in financial conditions.
Taken together, the pre-shock environment was characterized by:
- stable but supply-constrained labor markets,
- structurally persistent inflation dynamics, and
- equity markets pricing continued stability.
In other words, the global economy entered the shock from a position of resilience—but not from a position of excess flexibility — or mispricing capacity.
Then the shock hit.
THE INITIAL SHOCK: ENERGY REPRICING
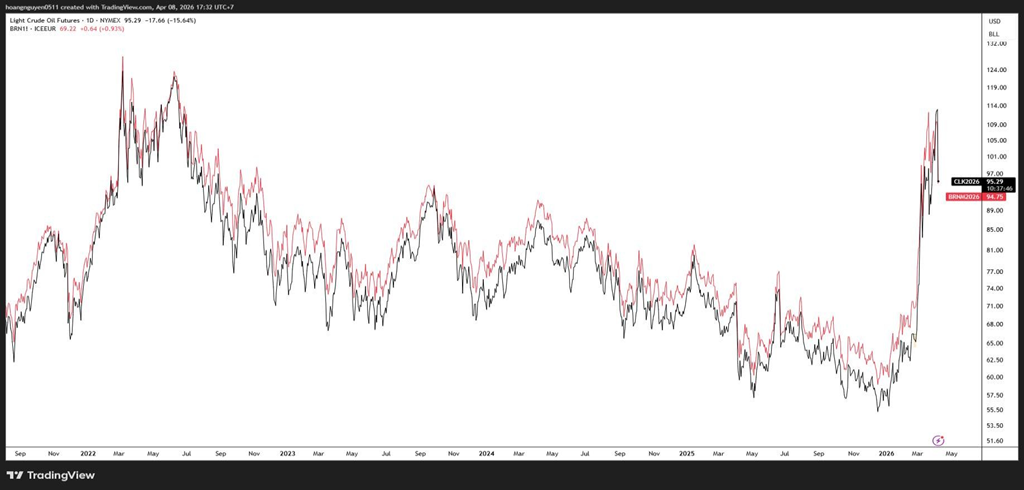
By March 2026, Brent crude was up 49.9% and WTI was up 48.6%. The disruption in the Strait of Hormuz has driven a sharp repricing in spot markets.
However, Brent is still below the $120 top observed in 2022 and only modestly above the $90 seen in 2023.
A similar pattern can be observed across broader energy markets.
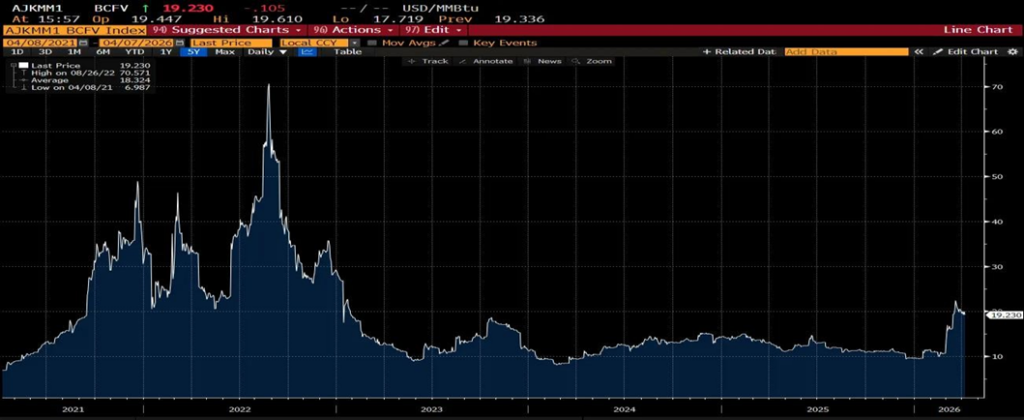
- LNG prices in Asia are approximately USD 20 per MMBTU. While this represents a notable increase, it does not exceed previously observed levels, contrasting with the peak price of USD 70 per MMBTU.
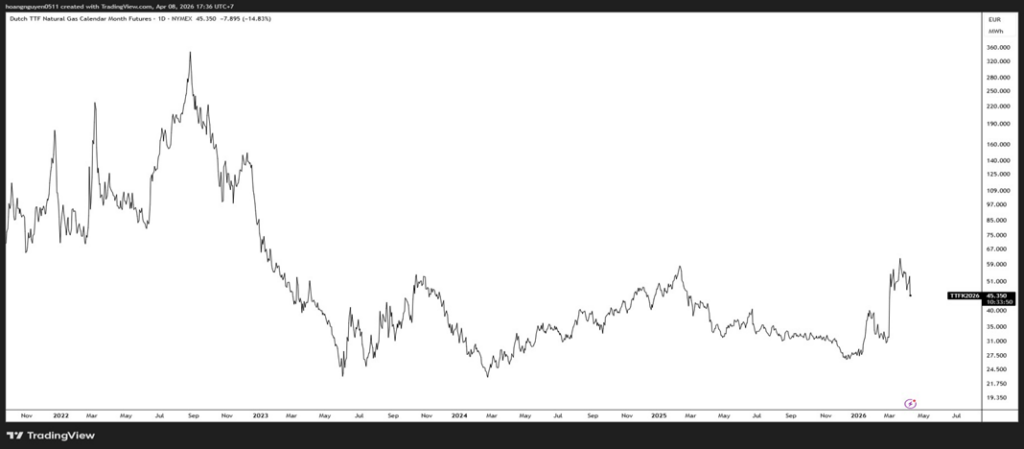
- European natural gas prices have risen to around €59/MWh – roughly doubling from recent lows, but broadly in line with levels observed over the past year.
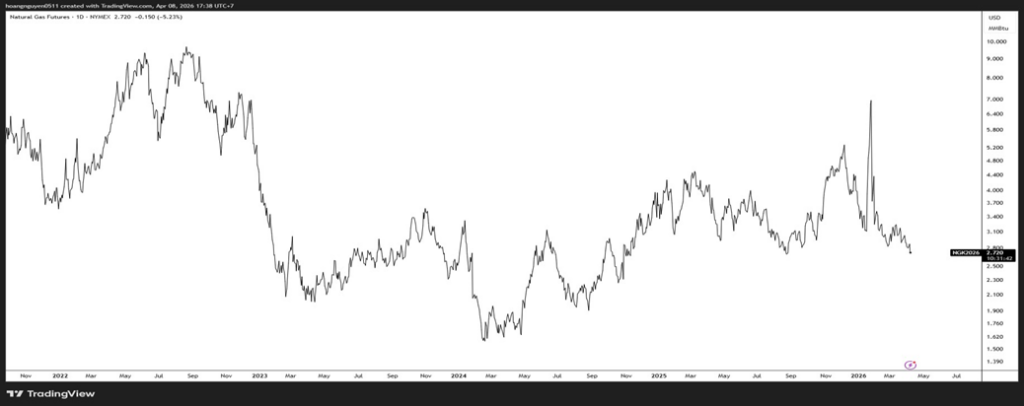
- U.S. natural gas prices remain subdued, trading below $3.
- Thermal coal prices in China have shown limited signs of stress.
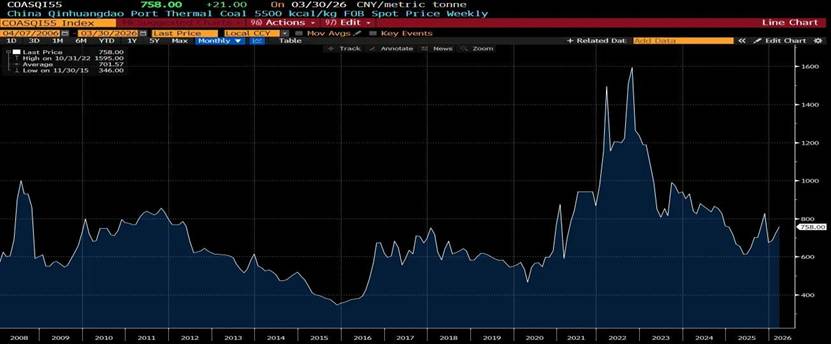
Taken together, Natural gas in the U.S. and coal in China are not spiking. If the core fuel for the world’s two biggest economies is stable, this raises a critical question: to what extent is the market pricing a systemic shock that is not yet evident in core energy fundamentals?
THE SPREAD TELLS THE STORY | DIVERGING SIGNALS ACROSS ENERGY AND RATES MARKETS
Brent is up 50% while WTI is up 48.6%. The divergence between Brent and WTI reflects the geographic nature of the shock: supply disruptions are more acute for import-dependent economies, particularly those exposed to flows through the Strait of Hormuz.
That spread widened for a reason: The U.S., which produces approximately 16% of global oil, is less directly exposed to this specific supply constraint. As a result, the shock is inherently uneven across regions.
This asymmetry has contributed to the emergence of two competing market narratives.
NARRATIVE 1: TEMPORARY DISRUPTION
The futures curve is in deep backwardation. Brent for December 2026 is trading around $79.02—only 12.5% higher than it was last June. This suggests that market participants expect the disruption to be resolved over a relatively short horizon.
There’s some logic here. We’ve already displaced about 11 million of the 20 million barrels per day that were blocked. Alternative export channels, including Saudi pipelines (7M bpd), Oman coastal shipping (1.6M), and UAE pipelines (1.5M), have partially offset the blockage, allowing global flows to adjust.
Inflation swaps agree: short-term expectations are up, but forward expectations are actually stable and slightly falling. Even with tariffs at 100-year highs, actual CPI fell 0.4% YoY. Mathematically, a 50% oil shock only adds about 1.5% to the general price level because energy is a small slice of the final price of most goods.
NARRATIVE 2: THE BOND MARKET REALITY CHECK
However, signals from the rates market present a more cautious interpretation.
The 10-year yield jumped from 3.97% to 4.30%—a 33 basis point move. Meanwhile, the 3-month T-bill hasn’t budged.
This divergence is notable.
When the short end stays still and the long end jumps, that isn’t a Fed signal— it typically reflects a reassessment of longer-term inflation expectations rather than a change in near-term monetary policy. This pattern is consistent across major markets, including Europe and Japan.
While the 2-year yield spiked to 4.00% due to a mechanical liquidity event (margin calls on leveraged trades), it has since pulled back. The 10-year has not. The short-term bond market “healed”, but the long-term bond market is holding its breath.
Taken together, the signal from the rates market is that inflation risks may prove more persistent than currently implied by energy pricing alone.
THE EQUITY REACTION
Equity markets remain relatively complacent. The risk premium is only up 0.40%, and the BBB default spread moved by approximately 8 basis points. VIX jumped from 19.86 to the low-30s, but remains well below levels typically associated with systemic stress. This isn’t panic selling; it’s an orderly repricing of economic damage.
Against this backdrop, the divergence between equities and rates is notable. While bond yields have moved sharply higher, equity markets have not meaningfully repriced risk.
Taken together, this divergence suggests that fixed income markets may be pricing a more persistent inflation and risk backdrop than is currently reflected in equities.
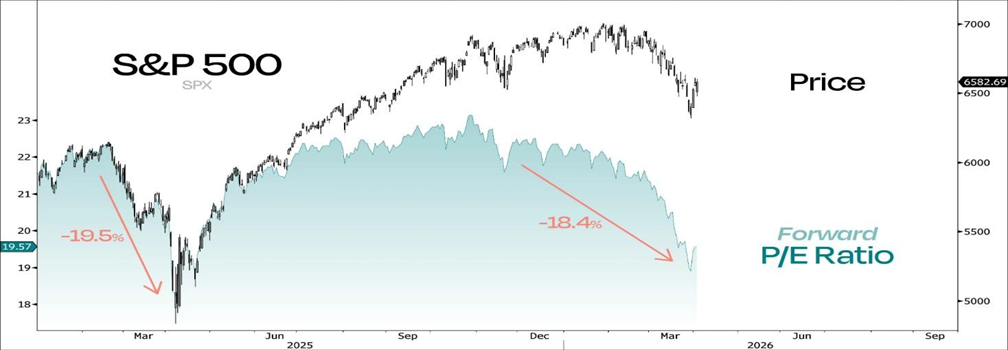
From an equity perspective, the adjustment has been driven primarily through valuation rather than earnings.
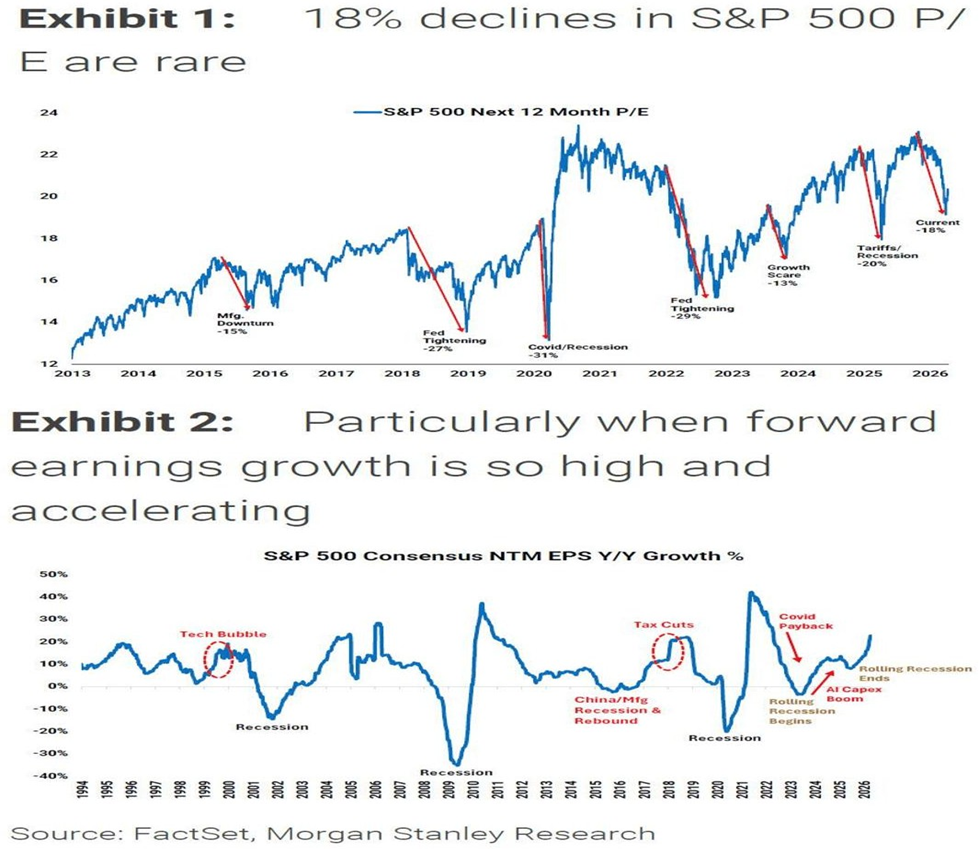
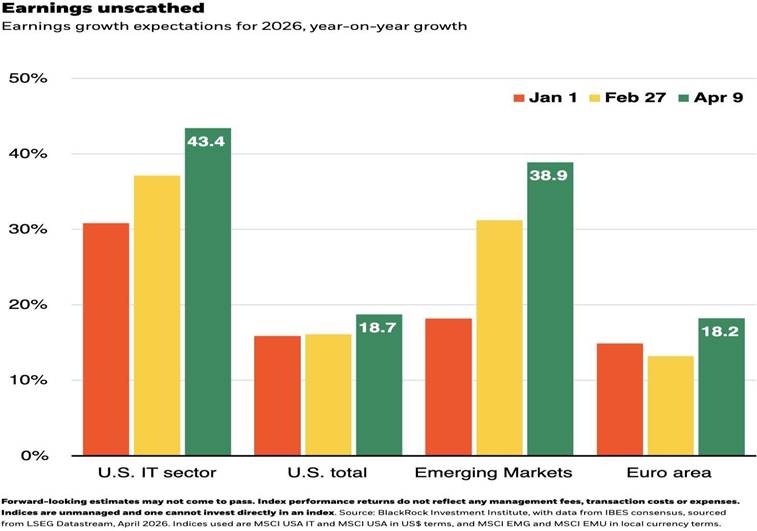
Price-to-earnings multiples have declined by approximately 18%—a relatively rare move—while forward earnings expectations continue to trend higher.
This creates a tension between valuation compression and earnings resilience. Expectations for 2026 corporate earnings in both the U.S. and Emerging Markets have actually climbed since the conflict began. While broader market narratives emphasize downside risks, the earnings outlook continues to reflect a growth-consistent trajectory.
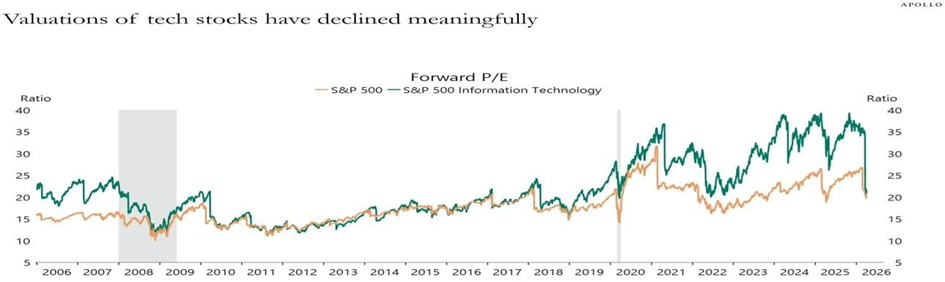
One of the most important developments since the strait closed is that the tech multiple just took a 50% haircut. We’ve watched valuations compress from 40x all the way down to 20x, effectively erasing every cent of the “AI premium” from the tape. We are officially back to valuation levels last seen before the AI boom even started.
In effect, the market has undergone a meaningful valuation reset without a corresponding deterioration in earnings expectations.
THE MISSING PIECE: ENERGY SHOCKS AND THE FOOD INFLATION CHANNEL
“Oil isn’t just gas for your car.
- Oil is Fertilizer: Ammonia is produced from natural gas, and the price follows oil.
- Oil is Diesel: Every ton of food moves by truck or ship.
- Oil is Packaging: Plastics are petroleum.
- Oil is Irrigation: The pumps don’t run on hopes and dreams.”
There is typically a lag of several months between energy price shocks and their transmission into end prices. Even a sharp move — such as a 50% increase in oil — does not immediately translate into higher costs at the farm level. Over the time, however, rising fertilizer costs, elevated logistics expenses, and broader input inflation begin to exert upward pressure on food prices.
Historically, oil shocks explain 38% of global headline inflation volatility. A 10% oil jump equals a 0.35 percentage point increase in inflation over a year. At 50%, we’re looking at a 1.5% to 1.75% global inflation hike—and most of that is coming from the grocery store, not the gas station.
This dynamic reflects a broader “cascading cost-push” mechanism, whereby initial energy shocks propagate through production networks and are gradually embedded in final prices — a process that standard models often underestimate.
Both narratives are true, but they live on different horizons.
- Short Term (0-3 Months): Supply alternatives exist. The futures curve says it’s temporary. Headline CPI hasn’t exploded yet. If the war ends tomorrow, everything rallies (except oil).
- Medium Term (3-12 Months): The second-round effects hit. Higher input costs begin to translate into food price inflation, and capital flows from the Middle East dry up as petrodollars are redirected to security and repairs.
The information asymmetry is clear: Commodity traders have priced the shock. The bond market has priced persistence. However, the equity market and the average consumer haven’t even begun to price the food shock coming in Q2 and Q3.
Scenario A is a quick fix. Scenario B is a long grind. Reality is in the middle, but right now, the market is leaning into the “everything is fine” camp.
LOOKING THROUGH THE WAR | FEAR IS A PRICING MECHANISM
We do not attempt to forecast geopolitical outcomes. The path of U.S.–Iran dynamics remains inherently uncertain, and headline-driven scenarios are, by construction, non-tradeable.
Instead, we focus on how shocks are transmitted, priced, and ultimately absorbed by the system.
Periods of heightened uncertainty often lead to a front-loading of risk premia. Fear, in this sense, is a pricing mechanism—the question is not whether risks exist, but whether they have already been priced.
Recent weeks have seen a rapid escalation in downside narratives across energy, commodities, and global supply chains. Market discourse has increasingly converged around worst-case scenarios, including sustained disruption to oil and LNG flows and second-round effects on food and industrial inputs.
Such skepticism is understandable. However, elevated uncertainty does not, in itself, constitute a systemic shock.
At present, segments of the market—particularly commodities and rates—have already incorporated a degree of persistence in the shock. The repricing of energy and the adjustment in term premia reflect this shift.
The broader system, however, is still in the process of reconciling those signals.
Here’s the reality, our company “OrigoX” still holds the same portfolio since founded in September last year: our positioning reflects a preference to avoid aggressive allocation in response to headline-driven risk.
Because what if the market is right?
A key question is whether a prolonged disruption would materially alter the macro-outlook. Here is where it gets interesting. If the Strait of Hormuz closed completely and permanently today, yeah, you would probably get a recession. But if this war in Iran grinds on for another year—disrupting shipping and adding risk premiums—and then the Strait closes?
The world will have already adapted.
Contingencies are being activated, alternative energy deals are being signed, and the plumbing of global trade is being rerouted as we speak. The longer the Strait remains an issue, the less it actually matters to the global economy. Iran is playing a desperate game of short-term gain for long-term pain, and they’re hurting themselves more than anyone else in the long run.
This introduces a non-linear dynamic, where the severity of the shock is highest at onset and diminishes as adaptation mechanisms take hold
We do not dismiss the risks.
But neither do we assume that worst-case scenarios will materialize in full.
The more relevant question is not whether the shock occurs, but whether it evolves into a self-reinforcing system-wide constraint.
At present, the evidence points to a different dynamic: a system that is repricing risk in the short term, while retaining the capacity to adapt over time.
IT’S HARD TO HAVE DEMAND DESTRUCTION
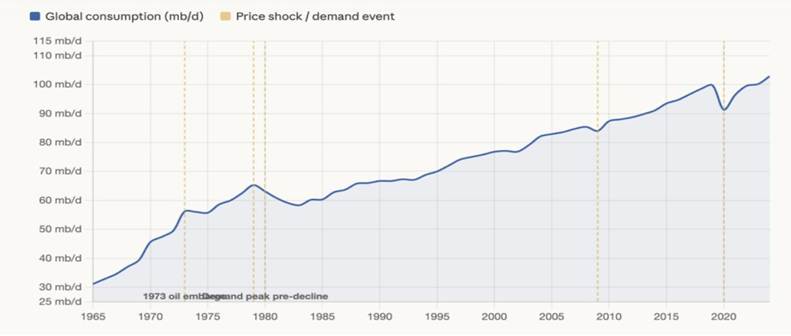
The concept of “demand destruction” is frequently invoked during energy price spikes. However, historical evidence suggests that oil demand is relatively inelastic in the short term.
Over the past several decades, meaningful declines in oil consumption have typically occurred only under extreme conditions—most notably during the COVID-19 lockdowns. Even during periods of severe economic stress, such as the 2008–2009 Global Financial Crisis, demand proved more resilient than headline narratives would suggest.
This reflects the essential nature of energy consumption across transportation, logistics, and industrial activity, where substitution effects are limited in the near term.
The reality is that this supply shock isn’t going to change consumption much; it’s just going to act as a giant, unavoidable tax. If oil prices remain elevated (e.g., around $100) over a sustained period, the macro impact is less about demand collapse and more about a persistent drag on growth via reduced household purchasing power and higher input costs.
THE END-GAME | ENERGY SHOCKS ARE FRONT-LOADED, NOT SYSTEMIC
The end-state of the current conflict is inherently uncertain, and any definitive geopolitical outcome remains difficult to forecast. Rather than focusing on specific scenarios, it is more useful to examine how the strategic value of energy as a geopolitical lever has evolved—and what that implies for markets.
Historically, control over energy supply—particularly through chokepoints such as the Strait of Hormuz—has represented a meaningful source of geopolitical influence. For decades, this dynamic constrained the willingness of external actors to engage in direct confrontation, given the potential for severe disruption to global energy markets. However, structural shifts in global energy production have altered this balance. The United States has transitioned into a net energy exporter, while supply has become more geographically diversified. As a result, the marginal effectiveness of energy as a geopolitical lever appears to have declined relative to prior decades
The experience of the 2022 European gas shock provides a useful reference point, Russia, they tried to freeze Europe by cutting off the gas, and NG prices screamed to 350 EUR/MWh – the equivalent of $400 a barrel. It was a massive shock, yet the German economy didn’t implode; unemployment stayed at boom-time levels. Russia fired the biggest energy shot in history and the target didn’t fall over.
What’s truly catastrophic for Iran is that their “weapon” only causes collateral damage to their potential allies. Russia at least targeted the nations funding their enemies. Iran is just annoying the Europeans and Asians who actually want a peaceful resolution.
By closing the Strait, they are forcing the Saudis and other regional players to realize that the IRGC is a liability that has to be removed. If you can’t be trusted to keep the taps open, your neighbors will eventually vote for regime change. The market sees this clearly. If you look at long-dated US natural gas futures (January 2030), you can see the 2022 Russian spike plain as day. The closing of the Strait of Hormuz? It’s barely a blip on the chart.
So what is the end game?
From a market perspective, the key issue is not the existence of geopolitical risk, but whether that risk translates into persistent, binding constraints on energy supply.
- If disruptions remain temporary or partially mitigated, the primary effect is likely to be higher volatility and elevated risk premia.
- If disruptions persist, adaptation mechanisms—through substitution, rerouting, and policy response—may limit the long-term economic impact.
In both cases, the transmission is more likely to occur through prices and income effects than through a sustained collapse in activity.
The trajectory of the conflict will ultimately be shaped by political and strategic factors beyond the scope of macro analysis. What matters for markets is more limited: whether energy disruptions evolve into sustained supply constraints—or remain manageable through adaptation and system-level adjustment.
JAPAN IN THE BIG PICTURE | THE WRONG KIND OF INFLATION
During the late 1980s, the appreciation of the Japanese yen—following the Plaza Accord—functioned as a powerful disinflationary force. For an economy highly dependent on energy imports, a stronger currency translated directly into lower import costs, effectively supporting real incomes and contributing to the domestic economic expansion.
The current environment represents a reversal of that dynamic. The yen has weakened materially, while global energy prices have risen amid geopolitical tensions. This combination generates cost-push inflation—driven by external price pressures rather than domestic demand.
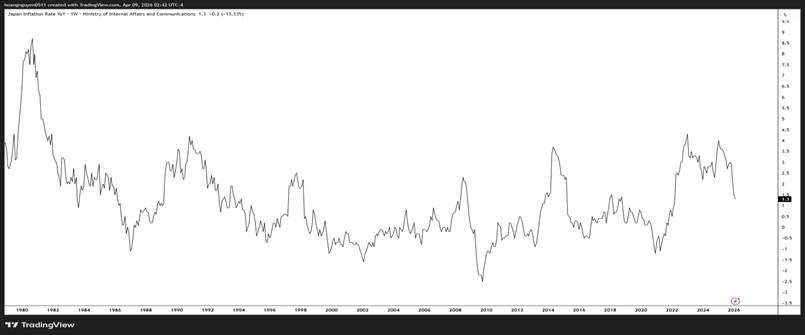
For 30 years, Japan lived in a world where prices and wages didn’t move. We called it “chronic deflation”. It wasn’t great for growth, but it created a “social norm” where people expected stability. This “deflationary equilibrium” limited the pass-through of exchange rate fluctuations into household purchasing power.
Since 2022, that regime has shifted. Headline inflation has reached levels not seen in decades, approaching 4% in both 2023 and 2025. This reflects a transition from a domestically anchored price system to one increasingly exposed to global cost pressures.
Japan’s exposure to imported energy amplifies this dynamic.
Energy accounts for approximately 7% of household expenditure, and a 10% increase in energy prices is estimated to add roughly 0.7 percentage points to headline inflation. When combined with yen depreciation, the effective increase in import prices is significantly magnified.
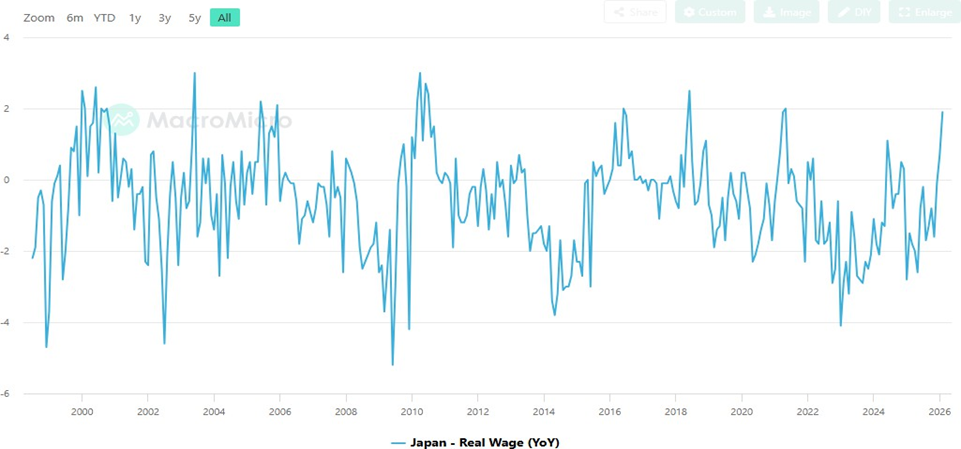
They’ve seen some of the biggest wage hikes in 30 years recently—unions secured 5% raises in 2024 and 2025. But it’s not enough. Because the cost of imported fuel and food is rising so fast, real wages (what your paycheck actually buys) have been falling for years. In 2025 alone, real wages dropped by 1.3%. People are working harder and getting record raises, yet they feel poorer. As a result, Japan remains in a regime of real income compression rather than a self-sustaining reflation cycle
THE BREAKING POINT: IRAN AND THE STRAIT OF HORMUZ | ENERGY DEPENDENCE HAS LONG CONSTRAINED STRATEGIC FLEXIBILITY
Japan’s vulnerability is not only a function of energy dependence, but of concentration.
Approximately 93% of its oil imports originate from the Middle East, with the majority transiting through the Strait of Hormuz. Disruptions to this chokepoint therefore represent a direct and material risk to energy supply.
In response, Japan has relied on its strategic petroleum reserves—estimated at approximately 250 days of consumption—to mitigate short-term supply shocks. While these reserves provide a buffer, they do not eliminate exposure to sustained disruption.
Historically, Japan tried to stay neutral or even mediated between the US and Iran to keep the oil flowing—think of the Nissho Maru incident in 1953 when a private Japanese tanker defied a British blockade to bring Iranian oil home.
The current environment, however, reflects a shift in strategic constraints. Japan’s security alignment has tightened, limiting its flexibility in navigating energy relationships, particularly in the context of sanctions and broader geopolitical tensions.
WHAT HAPPENS NEXT?
The next phase of the adjustment may hinge on the trajectory of the Japanese yen.
A move forward, 170 USDJPY represents a critical threshold, it’s the edge of a cliff. Back in the 80s, Japan was neutral between the Iran-Iraq war and the yen was getting stronger. Today, they have picked a side in the US-Iran conflict, and their currency is at its weakest in 30 years. If the yen crosses that historical 170 line while the Middle East is on fire, the “cost-push” inflation will become politically unsustainable.
Japan has already experienced a shift toward higher nominal wage growth. However, as previously discussed, real income dynamics remain under pressure due to imported cost inflation. A further weakening of the yen toward extreme levels would amplify this imbalance, increasing the likelihood of policy response—either through direct FX intervention or broader tightening of domestic financial conditions.
- MONETIZING THE CREDITOR POSITION: THE U. S. TREASURY “CARD”
Japan is the world’s largest foreign holder of U.S. government debt, with a portfolio exceeding $1.1 trillion. This position represents significant financial leverage:
- The “Fire Sale” Risk: A disorderly liquidation of U.S. Treasuries is unlikely to be the primary channel. Such an action would be self-defeating—undermining Japan’s reserve stability, disrupting its domestic financial system, and amplifying global volatility. The relevant dynamic is not stock liquidation, but flow adjustment. A reduction in incremental demand—or a gradual shift toward capital repatriation—would be sufficient to exert upward pressure on long-term yields. Given Japan’s role as a structural buyer of U.S. duration, even a marginal change in allocation could have meaningful effects on global rates.
- Explicit Policy Signaling: This interpretation is consistent with recent policy signaling. In early 2025, Finance Minister Katsunobu Kato referred to Japan’s Treasury holdings as a “card” in negotiations—highlighting the strategic importance of this position without implying imminent liquidation.
- TRIGGERING MASSIVE CAPITAL REPATRIATION
Japan’s role as a global capital exporter creates a powerful transmission channel through financial flows:
- Carry Trade Unwind: Japanese investors hold nearly $4 trillion in overseas assets. By allowing domestic Japanese Government Bond (JGB) yields to rise—which reached 20-year highs in early 2026—the government creates a “self-accelerating cycle” where capital flows back to Japan.
- Financial Repression and Domestic Incentives: The 2025/2026 tax reforms, including the Global Minimum Tax (Pillar 2) and the Special Defense Corporation Tax, introduce structural incentives for capital reallocation for Japanese multinationals to repatriate earnings rather than keeping them in low-tax jurisdictions.
Taken together, these dynamics point to a gradual reallocation of capital away from global markets and back into domestic assets
- EXPLOITING “TRUSTED INTERMEDIARY” STATUS WITH TEHRAN
Unlike other G7 nations, Japan maintains a unique “neutral-friendly” relationship with Iran, which introduces an additional channel of flexibility:
- The Hormuz “Release Valve”: In March 2026, Iranian Foreign Minister Abbas Araghchi indicated that Tehran was prepared to allow Japanese-affiliated vessels safe passage through the Strait of Hormuz despite the blockade. This provides Japan with a specific diplomatic advantage; by securing its own energy supply while the rest of the world remains blocked.
- Back-Channel Diplomacy: Japan has established an “International Peace Mediation Unit” to leverage its history of “shuttle diplomacy” from the 1980s. Prime Minister Takaichi has already used high-level calls with the Iranian President to coordinate de-escalation steps. These dynamics do not determine outcomes directly, but they introduce additional complexity into global coordination and reduce the likelihood of a fully synchronized supply shock.
- CONDITIONING SECURITY “BURDEN SHARING”
Japan’s security alignment with the United States introduces an additional layer of constraint, linking external commitments with domestic economic conditions:
- Constitutional “Red Lines”: President Trump has repeatedly called for Japan to deploy warships or minesweepers to the Gulf. The Takaichi administration has used Japan’s legal and constitutional constraints as leverage, making any future maritime cooperation contingent on a clear U.S. commitment to diplomatic de-escalation.
- Resource Redirection: Japan can point to the $58 billion defense budget it passed in 2026, arguing that the economic drain caused by the war’s impact on the yen and oil prices makes it impossible for Japan to sustain its military buildup in the Indo-Pacific—a region the U.S. considers its top strategic priority. This creates a linkage between external commitments and internal economic stability.
USDJPY is not just a currency pair—it is a transmission channel for global financial conditions.
CHINA AS A MISPRICED HEDGE
Market sentiment toward China remains cautious, reflecting concerns around geopolitical risk and domestic growth dynamics. However, this positioning may be overlooking key structural offsets.
From a macro perspective, China appears relatively insulated from the stagflationary pressures affecting other regions, particularly in Europe.
This reflects two primary factors:
- diversified and secure energy supply, including Russian imports
- significant domestic electrification and industrial capacity
As a result, China’s exposure to externally driven cost-push inflation is more limited
1. THE INDUSTRIAL LEAPFROG
Following tightening in global supply chains since 2018, China has accelerated the reallocation of capital toward high-end manufacturing.
They effectively sacrificed their property sector to build the industrial base of the future. The result? China has gained competitive advantage in selected sectors like EVs (BYD), batteries (CATL), and LiDAR (Hesai).
Underpinning all of this is a simple fundamental truth: economic activity is energy transformed. While the West is struggling with aging grids, China has over-invested in a massive, reliable energy mix of coal, nuclear, and renewables. By combined with relatively low and stable energy costs, this has reinforced China’s position as a cost-efficient manufacturing base.
2. THE REPATRIATION WAVE
For years, the Renminbi (RMB) operated within a framework that supported export competitiveness and encouraged offshore accumulation of USD assets.
This dynamic is evolving.
As U.S. rates stabilize and currency expectations adjust, the relative attractiveness of offshore USD holdings has diminished. This introduces incentives for a partial reallocation of capital toward domestic assets.
While capital controls limit full transmission, even incremental shifts in allocation could provide support to local markets.
3. ASYMMETRIC POSITIONING
From a positioning perspective, China remains structurally under-owned. Following the lockdown period and property sector adjustment, Western institutional capital has materially reduced exposure.
This has created a notable allocation disconnect: China represents nearly 20% of global GDP, yet most Western investors have low allocation to this massive country.
When the consensus is this one-sided, the downside is priced in and the upside is asymmetric. Any return of capital to the region, even a small trickle, can have a disproportionate impact on asset prices.
4. POLICY BACKSTOP AND MARKET STABILIZATION
Policy has shifted toward a more supportive stance. Fiscal expansion—reflected in a deficit approaching 10% of GDP—combined with targeted liquidity measures, indicates a renewed focus on stabilizing growth and restoring confidence.
In parallel, authorities have demonstrated a willingness to intervene during periods of market stress, particularly when asset price declines risk broader economic or social instability
While this does not constitute an explicit “policy put,” it establishes a form of downside stabilization that can dampen volatility and support risk sentiment.
Policy acts as a volatility dampener rather than a growth accelerator. IMPLICATIONS FOR ALLOCATION
From an allocation perspective, the opportunity set in China is best understood through a set of structural exposures rather than individual securities.
Three segments appear particularly relevant including leading players across these segments:
- Industrial and Supply Chain Leaders: Companies positioned at the core of global manufacturing and energy transition supply chains (BYD, CATL).
- Platform and Network Leaders: The large-scale domestic platforms like Baidu, Tencent and Alibaba that maintain massive margins.
- Yield-Oriented Resource Assets: Energy and resource-linked companies offering stable cash flows and attractive dividend yields in the 5%–6.5% range (e.g., PetroChina, Zijin Mining).
SYNTHESIS
The global macro regime that defined the 2014–2019 period—characterized by low inflation, abundant labor supply, and near-zero cost of capital—has structurally shifted. But that doesn’t mean we’re heading for a 1930s-style collapse. It means we are recalibrating to a world where “flat” is the new “up” and where the cost of capital finally matters again.
1. The Labor and Inflation Myth
The bears see a headline payroll number of 50,000 and interpret it as recession risk. But that framework may no longer fully capture underlying conditions.
Because of declining immigration flows and demographic shifts, the Dallas Fed has indicated that the “break-even” employment rate has fallen materially. We no longer need 250,000 jobs a month to maintain labor market stability. The
U.S. labor market isn’t necessarily weakening—it is operating with a smaller denominator.
Meanwhile, inflation has evolved. It’s no longer about temporary spikes in categories like eggs or used cars. The process has become more structural.
The “lower tail” of deflation appears to have weakened, and wage growth in services is creating a floor that makes a sustained return to 2% inflation increasingly challenging.
We are moving within a reflationary regime, and even Fed research is beginning to reflect a shift in how the inflation process is understood
2. The Iranian Energy Bluff
Iran is often perceived as holding significant leverage over global energy markets through the Strait of Hormuz. However, that leverage may be more limited than commonly assumed.
This is not 1979. North America has emerged as a major energy producer, and the U.S. became a net exporter—fundamentally altering the global energy balance. The experience of Russia’s use of the “energy weapon” in Europe also suggests that even large-scale disruptions do not necessarily translate into sustained economic breakdown.
In the short term, the situation is characterized by supply disruptions and volatility. But the longer-term outlook for energy stability may be more resilient than headline narratives suggest. Production and trade flows are already being rerouted toward more stable hubs, including the U.S. and Australia. As the disruption persists, adaptive mechanisms begin to take hold. Over time, the marginal impact of the shock may diminish as the system adjusts
3. The Japan “Margin Call”
If you want to identify where system-level tension is most concentrated, Japan stands out.
The combination of a weakening yen and elevated imported energy costs is creating a form of cost-push inflation that is difficult to absorb. This is the “wrong kind” of inflation—externally driven and compressing real incomes rather than reflecting domestic demand strength.
Watch the 170 level on USDJPY. That is the edge of the cliff. A move toward that range would likely intensify domestic pressures and increase the probability of policy response.
Japan retains multiple financial and external channels through which it can influence global conditions. Its position as the largest foreign holder of U.S. Treasuries—at over $1.1 trillion—remains strategically significant. However, the more relevant dynamic is not a disorderly liquidation, but the adjustment of flows.
A shift in allocation—whether through reduced demand for U.S. duration or increased capital repatriation—would be sufficient to exert upward pressure on global yields.
In this framework, Japan does not need to trigger a shock to influence outcomes—incremental changes in capital flows can materially tighten global financial conditions
4. China: The Asymmetric Structural Haven
The consensus view on China reflects a combination of elevated uncertainty and potential mispricing.
- Energy Insulation: China benefits from relatively diversified energy inputs, including access to Russian supply and significant domestic electrification capacity. While not fully insulated, this structure reduces exposure to the stagflationary dynamics affecting more energy-import-dependent economies.
- The Manufacturing Moat: The reallocation of resources away from the property sector toward advanced manufacturing has strengthened China’s position in key industrial segments, including electric vehicles and high-end production. Combined with relatively low and stable industrial energy costs, this supports a structurally competitive manufacturing base.
- The Capital Reallocation Dynamic: As U.S. rates stabilize and currency expectations adjust, the relative attractiveness of offshore USD holdings has diminished. This introduces incentives for incremental capital reallocation toward domestic Chinese assets, providing a potential tailwind to local markets.
5. The Real Trade: Cost of Capital
The path of geopolitical developments remains inherently uncertain. Energy prices may move in either direction depending on the evolution of the conflict.
The more observable and structurally relevant variable is the cost of capital. The shift in policy regimes—combined with tighter financial conditions—signals the end of the low-cost capital environment that defined the previous cycle. Look at the 30-year JGBs. The sell-off has resumed, yields are back near the highs, and the world is finally realizing that money isn’t free anymore.
The key shift is not cyclical but structural: capital is no longer abundant, and its price is rising.
In this environment, positioning is better framed around structural alignment rather than short-term reaction:
- Monitor USDJPY as a Liquidity Signal: The 170 level represents a potential inflection point. Movements toward that range could signal tightening global liquidity conditions via capital flow adjustments.
- Maintain Exposure to Energy and Security-Linked Assets: Energy independence is no longer a “nice to have”; it’s a national security requirement for every country on earth. Demand will stay high long after this war ends. Be ready to re-long Oil once the tactical dust settles.
- Diversify Across Regions with Differentiated Exposure: Markets with lower sensitivity to Western financial tightening and energy shocks—particularly parts of Asia—may offer relative insulation
- Prioritize Balance Sheet Strength: In a higher cost-of-capital environment, companies with low leverage, strong cash flow generation, and consistent dividend profiles are structurally advantaged.
- Focus on Rates as the Primary Signal: The 30-year JGB and the 10-year Treasury are your north star.
In this regime, the key constraint is no longer growth, but the cost of capital that sustains it—and the repricing of that constraint will define the next cycle.